Data on Native Students
The following are demographics and statistics about our American Indian and Alaska Native (AI/AN) populations and students. NIEA encourages utilizing statistics and education data to make informed decision leading to improved education systems serving Native students.
Notes: AI/AN refers to American Indian and Alaska Native. NHOPI refers to Native Hawaiian and Other Pacific Islander. “Alone” means not in combination with any other race. “In combination” means in combination with at least one other race.
Student Demographics
*Indicates that the measure includes multiracial AI/ANs or multiracial Native Hawaiians.
Youth . . .
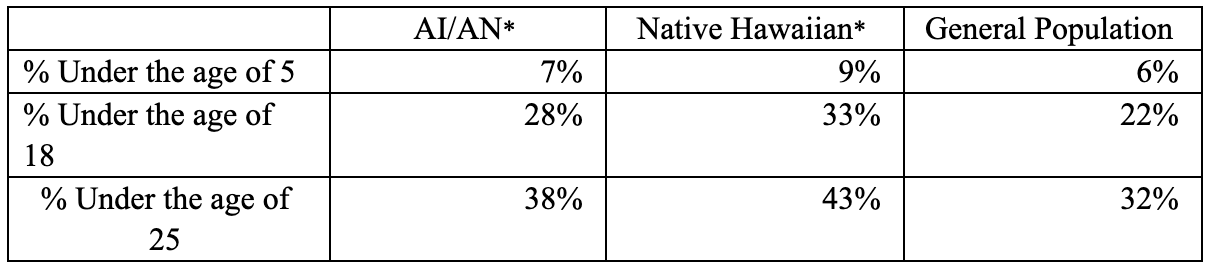
- Compared to the general population, youth comprise a higher percentage of the Native population. The following table gives the percentage of youth in AI/AN and Native Hawaiian communities, as well as the general U.S. population. 1
Public Schools . . .
- There are approximately 459,000 AI/AN students and 180,000 NHOPI students in the K-12 public school system nationally, comprising 1% and 0.4% of all public-school students, respectively. 2
- 93% of AI/AN students and 92% of NHOPI students attend public schools. 3
- The five states with the largest proportions of AI/AN public-school students are Alaska (22.0%), Oklahoma (12.0%), Montana (11.0%), South Dakota (10.7%), and New Mexico (10.3%). The five states with the largest proportion of NHOPI public-school students are Hawaii (26.6%), Alaska (3.0%), Utah (1.6%), Nevada (1.5%), and Washington (1.2%). 4
- About a quarter (24%) of AI/AN public-school students attend schools where the majority of students are AI/AN. On the other hand, about half (49%) attend schools where less than 10% of the student body is AI/AN. 5
- Only 7% of NHOPI public-school students attend schools where the majority of the student body is NHOPI; 70% attend schools where less than 10% of students are NHOPI. 6
- The high school graduation rate for AI/AN students in public schools was 74% in 2019, 7 up from 67% in 2012. 8
- School choice is limited for many AI/AN students. Traditional public schools are the only options in 84% of school districts with significant (greater than 25%) AI/AN student populations. This means that students in these districts have no charter, magnet, or BIE options available to them. 9
The Bureau of Indian Education (BIE) . . .
- The Bureau of Indian education currently funds 187 schools for AI/AN students. Of those 187 schools, 130 are tribally controlled elementary and secondary schools, and 55 are BIE-operated elementary and secondary schools, and two are BIE-operated postsecondary institutions. 10
- A little under 7% of AI/AN students attended BIE-funded schools in the 2020-2021 school year. 11
- During the 2020-2021 school year, 34,529 students went to BIE-funded schools. 24,240 of those students attended tribally controlled schools, and the other 10,289 attended BIE-operated institutions. 12
- The states with the highest number of BIE-funded students are Arizona (9,113 students), New Mexico (7,439 students), South Dakota (5,352 students), North Dakota (3,193), and Mississippi (2,104). 13
Poverty . . .
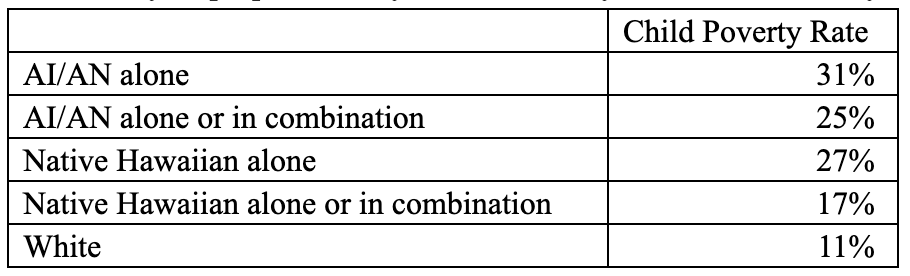
- Poverty disproportionately affects Native youth, as indicated by the following table. 14
- Over one-third (37%) of AI/AN students and one-quarter (25%) of NHOPI students attend high-poverty public schools. That is compared to just 8% of white public school students. 15
- 69% of AI/AN students and 59% of NHOPI students attend schools where more than half of all students are eligible for free or reduced-price lunch. 16
Teachers . . .
- Native students are less likely than their white peers to have a teacher that shares their racial and ethnic background. Nationwide, whereas 1% of students are AI/AN, only 0.5% of teachers are AI/AN. Similarly, NHOPI students comprise 0.4% of all students, but less than 0.2% of all teachers. 17
- The vast majority of teachers in majority-AI/AN schools are white (61%). In fact, only 29% of teachers in majority-AI/AN schools are AI/AN. 18
- In schools where the majority of students are NHOPI, 19% of teachers are NHOPI, and 26% are white. 19
- In Alaska, only 10% of teachersxx are AI/AN compared to 22% of students. 21
- Similarly, in Hawaii, only 10% of public-school teachersxxii are Native Hawaiian, compared to 24% of public-school students. 23
Higher Education . . .
- 84% of AI/AN adults (age 25 and up) and 92% of Native Hawaiian adults have a high school diploma or higher. 21% of AI/AN adults and 24% of Native Hawaiian adults have a bachelor’s degree or higher. 24
- There are 32 accredited Tribal Colleges and Universities (TCUs) in the United States. Combined, they offer 358 total programs, including 181 associate degrees, 40 bachelor’s degrees, and 5 master’s degrees. 25
- In 2019, TCUs had a total enrollment of 15,323 students, and 80% of those students (12,210) were AI/AN. Combined, they awarded 1,139 associate degrees and 378 bachelor’s degrees to AI/AN students. 26
Proficiency . . .
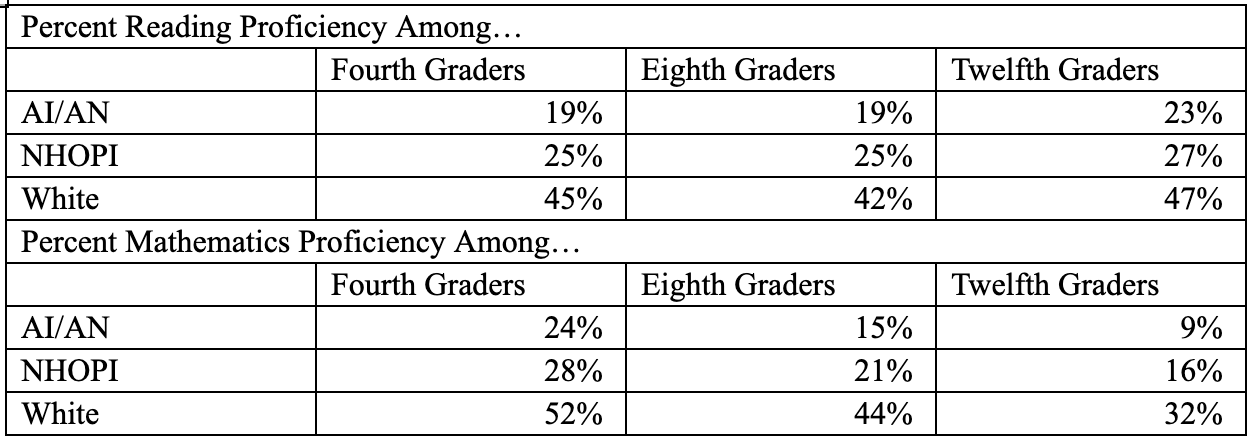
- In 2019, Native students scored lower than their white peers on standardized tests. 27
School Environment . . .
- 24% of AI/AN students attend rural schools, a rate more than 2.5 times that of any other racial or ethnic group. Around 2% of NHOPI students attend rural schools. 28
- The Individuals with Disabilities Act covers 15% of AI/AN students in public schools. 29
- A little over 3% of Native Hawaiian* children are disabled. 30
- Nearly 2,000 schools in the United States have Native mascots, logos, or nicknames. The states with the highest number of secondary schools with such mascots are Ohio (77), California (75), New York (58), Illinois (52), and Texas (51). 31
- In 2018, over a quarter of AI/AN students aged 12-18 (27%) reported experiencing bullying within the last year. 32
- AI/AN students are significantly more likely than any other racial group to report being afraid of attack or harm while at school— 14% of AI/AN students aged 12-18 reported these concerns. This rate is over twice that of any other racial or ethnic group and about three times the national average. 33
- In 2019, a third (33%) of AI/AN high schoolers reported using alcohol with in the last month, 34 and nearly a quarter (24%) reported that illegal drugs were made available to them on school property. 35 Those rates were 42% 36 and 17%, 37 respectively, for NHOPI high schoolers.
- AI/AN students have some of the highest rates of suspension of any racial or ethnic group. A little over 21% of AI/AN middle and high schoolers reported having been suspended at least once in their life, compared to 12% of white middle and high schoolers. 38
Home Environment . . .
- 22% of AI/ANs and 15% of Native Hawaiians speak a language other than English at home. 39
- Native households are less likely to be able to adjust to remote or virtual learning. 10% of AI/AN and 6% of Native Hawaiian households were without access to a personal computer. Additionally, 20% of AI/AN households and 13% of Native Hawaiian households are without access to a broadband Internet subscription. 40
- 15% of AI/ANs and 6% of Native Hawaiians do not have health insurance. 41
Sources
U.S. Census Bureau, 2019 American Community Survey, Table S0201.
National Center for Education Statistics (NCES), 2021, Table 203.50, https://nces.ed.gov/programs/digest/d21/tables/dt21_203.50.asp?current=yes.
NCES, Common Core of Data, "Public Elementary/Secondary School Universe Survey", 2020-21 v.1a.
NCES, 2021, Table 203.70, https://nces.ed.gov/programs/digest/d21/tables/dt21_203.70.asp?current=yes.
NCES, 2021, Table 216.55, https://nces.ed.gov/programs/digest/d21/tables/dt21_216.55.asp?current=yes.
Ibid.
NCES, 2021, Table 219.46, https://nces.ed.gov/programs/digest/d20/tables/dt20_219.46.asp.
NCES, 2014, Public High School Four-Year OnTime Graduation Rates and Event Dropout Rates: School Years 2010–11 and 2011–12, https://static1.squarespace.com/static/5cffbf319973d7000185377f/t/5db308ed40dd9a42bbc056a9/1572014318595/1-2014391.pdf.
Government Accountability Office. 2019. "Limited Options Available for Many American Indian and Alaska Native Students," https://www.gao.gov/assets/gao-19-226.pdf.
BIE 2022, https://www.bie.edu/schools/directory.
NCES, CCD, "Public Elementary/Secondary School Universe Survey", 2020-21 v.1a.
Ibid.
Ibid.
U.S. Census Bureau, 2019 American Community Survey, Table S0201.
National Center for Education Statistics. (2022). Concentration of Public-School Students Eligible for Free or Reduced-Price Lunch. Condition of Education. U.S. Department of Education, Institute of Education Sciences. Retrieved [date], from https://nces.ed.gov/programs/coe/indicator/clb.
NCES, 2021, Table 216.60, https://nces.ed.gov/programs/digest/d21/tables/dt21_216.60.asp?current=yes.
NCES, National Teacher and Principal Survey, "Public School Teacher Data File," 2017–18.
National Center for Education Statistics, 2020, "Race and Ethnicity of Public School Teachers and Their Students," https://nces.ed.gov/pubs2020/2020103/index.asp.
Ibid.
NCES, National Teacher and Principal Survey, "Public School Teacher Data File," 2017–18.
NCES, CCD, "Public Elementary/Secondary School Universe Survey", 2020-21 v.1a.
OHA, 2018 Education Databook, https://files.hawaii.gov/dbedt/economic/databook/db2018/section03.pdf.
OHA, 2020 Education Databook, https://files.hawaii.gov/dbedt/economic/databook/db2020/section03.pdf.
U.S. Census Bureau, 2019 American Community Survey, Table S0201.
US Department of Education, 2022, "Tribal Colleges and Universities," https://sites.ed.gov/whiaiane/tribes-tcus/tribal-colleges-and-universities/.
NCES, 2019, Table 312.50, https://nces.ed.gov/programs/digest/d21/tables/dt21_312.50.asp?current=yes.
U.S. Department of Education, Institute of Education Sciences, National Center for Education Statistics, National Assessment of Educational Progress (NAEP), 2019 Reading Assessment and 2019 Mathematics Assessment, https://www.nationsreportcard.gov/ndecore/landing.
NCES, CCD, "Public Elementary/Secondary School Universe Survey", 2020-21 v.1a.
US Census Bureau, 2020 American Community Survey (ACS), Tables B14007C; US Department of Education, EDFacts Data Warehouse: “IDEA Part B Child Count and Educational Environments Collection,” 2020-21. From file specifications 002 and 089.
US Census Bureau, 2019 ACS, Table S0201
National Congress of American Indians, 2022, "National School Mascot Tracking Database," http://bit.ly/schoolmascotdatabase.
National Center for Education Statistics, 2020, Table 230.40, https://nces.ed.gov/programs/digest/d20/tables/dt20_230.40.asp?current=yes.
National Center for Education Statistics, 2020, Table 230.70, https://nces.ed.gov/programs/digest/d20/tables/dt20_230.70.asp?current=yes.
NCES, 2020, Table 232.10, https://nces.ed.gov/programs/digest/d20/tables/dt20_232.10.asp?current=yes.
NCES, 2020, Table 232.70, https://nces.ed.gov/programs/digest/d20/tables/dt20_232.70.asp?current=yes.
NCES, 2020, Table 232.10, https://nces.ed.gov/programs/digest/d20/tables/dt20_232.10.asp?current=yes.
NCES, 2020, Table 232.70, https://nces.ed.gov/programs/digest/d20/tables/dt20_232.70.asp?current=yes.
NCES, 2021, Table 233.20, https://nces.ed.gov/programs/digest/d20/tables/dt20_233.20.asp?current=yes.
US Census Bureau, 2019 ACS, Table S0201.
Ibid.
Ibid.

Databases

Reports